Foundations
Fundamentals about inflation
➀ Understanding inflation
➁ Analyzing inflation
➂ Predicting inflation
We all have basic intuition of inflation from our daily experience looking at prices change in the marketplace. But we often lack the little amount of nuance and confidence in our understanding of the phenomenon that would allow us to actually make relevant decisions in our work. You will find here the essential knowledge that all humanitarian staff should have about inflation. Whichever your role is in your team, this is enough to enable you to start taking appropriate action upon observing rising economic challenges.
Inflation in itself is not necessarily a problem, it is high or unexpected inflation that creates a problem!
To understand inflation, we need to pay attention both to levels (how high it is) and to speed (how fast it changes) in the inflation rate. High inflation will essentially affect the purchasing power of people and what they can afford to buy with the budget that they have. Rapid inflation will in addition affect the predictability of prices and the capacity of people to plan their expenses appropriately.
We also typically want to understand whether inflation is affecting all prices in the same way and at the same time (how even it is). To understand the eveness of inflation by price categories, we will look at specific sets of prices such as food, water, fuel, housing, or the prices of imported goods for example.
Depending on whether inflation affects some prices more than others, different segments of population will be affected in different ways or at different times.
Pure inflation is not a problem. When all prices - including wages - go up at the same time, it doesn't change what you can buy with what you earn. Low and steady levels of inflation (but not zero) are actually a sign of economic growth and can help make recessions shorter.
BUT in practice inflation often doesn't affect all prices at the same time! Not all prices adjust easily: think about how easy it is to re-write the price of food items in a marketplace compared to reprinting menus in restaurants! In general, all written prices, and in particular wages & contractual prices, are not revised as fast as other commodity prices go up. Contracts are often only renegotiated when the contract period ends and a new contract is drafted. As a result, the wages of the poor are often the last prices to be adjusted in periods of inflation, because on top of everything they usually don't hold a lot of bargaining power when the time to negotiate comes. That's how people with low income are pushed out of market access because of inflation.
With inflation, we need to pay attention to contract prices (aka all the documents in which a number in a given currency is written down). For humanitarians, that includes the contracts with our suppliers and partners, but also our budgets and our grants!
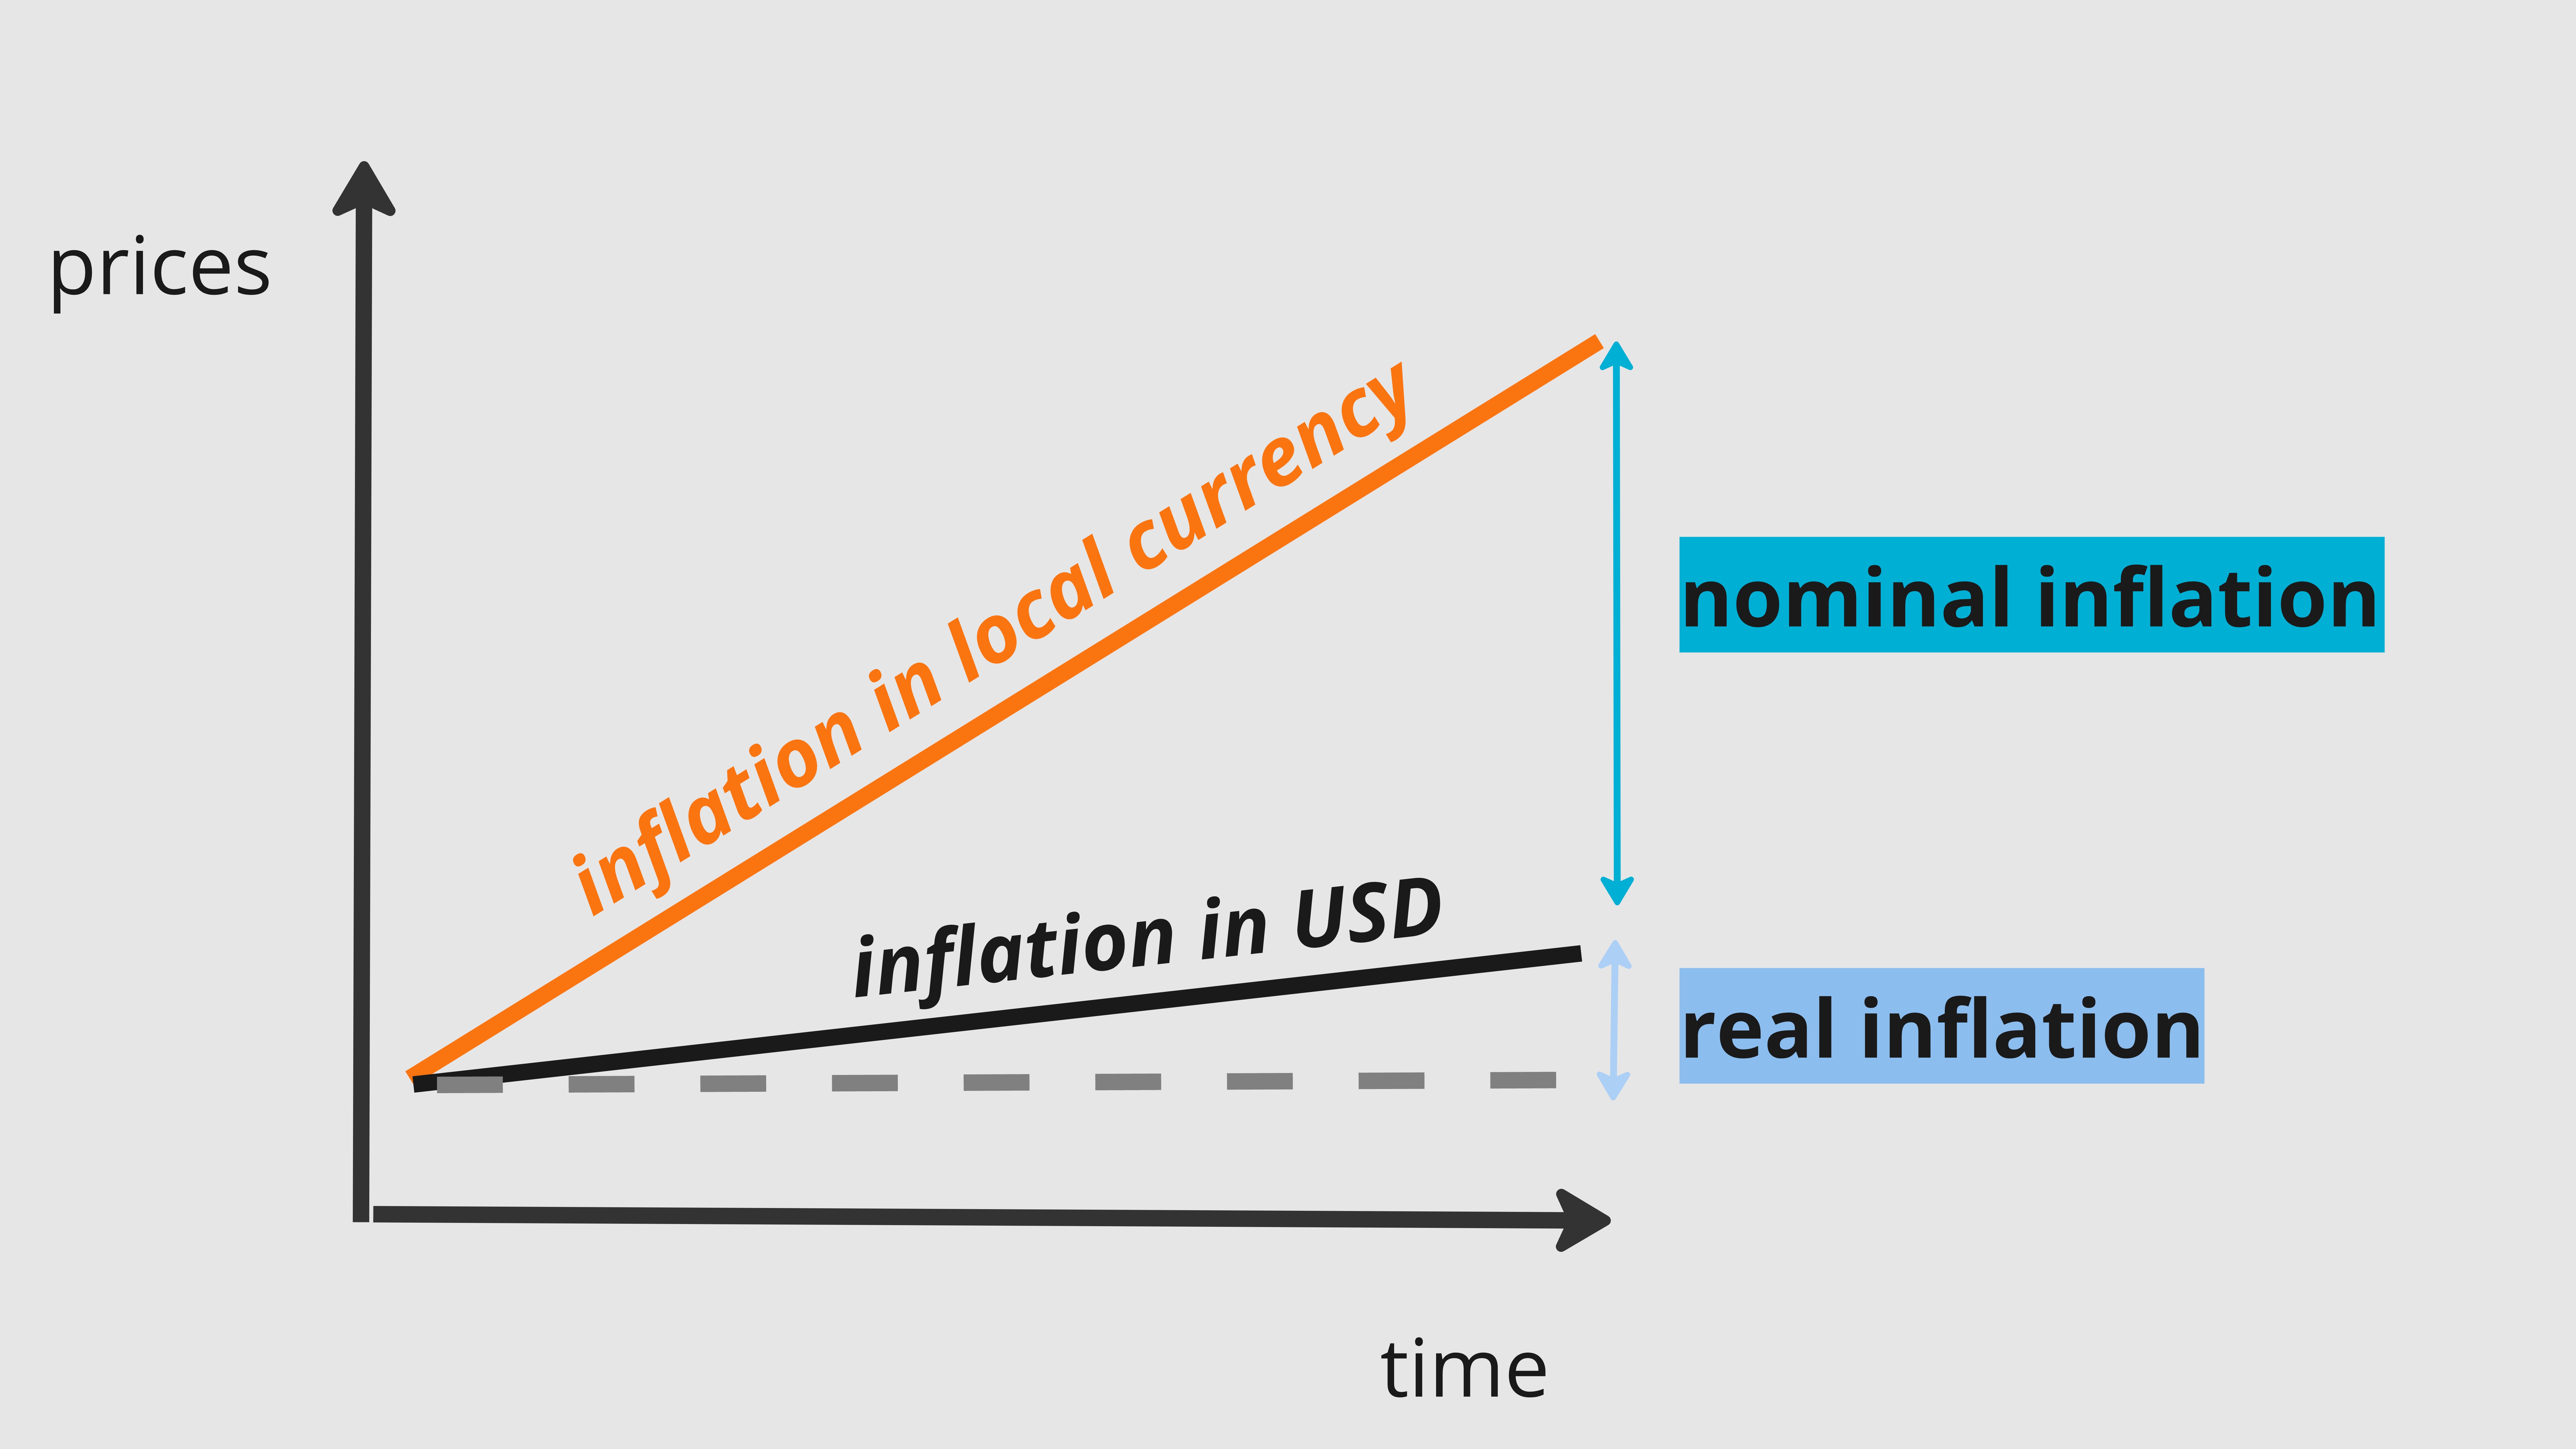
It is also important to be able to distinguish between 'real' increases in prices and 'nominal' increases in prices, by comparing inflation in local currency versus inflation in hard currency. There are different sources of inflation. Sometimes inflation comes from an increase in the costs of procuring or producing things such that overall there is less stuff available to buy (which means stuff is 'really' more expensive, whichever currency you express its price in). Other times inflation is related to a depreciation in the value of the local currency: there is more money in circulation for the same amount of stuff to buy with it (which means stuff only look more expensive 'nominally' - you see inflation when prices are expressed in local currency, but not (or less so) when prices are expressed in other currencies).
In short nominal inflation affects only prices in local currency, while real inflation affects both prices in local currency and prices in hard currency. In a given period of inflation, a part of the inflation will be nominal and another part will be real: the important is to be able to roughly understand in which proportions!
While both real and nominal inflation will affect the purchasing power of the population, only the former typically affects the value of our budgets since they are set in foreign currencies.
In order to make the adequate and relevant decision regarding how to design our programming and how to run our operations, we need to measure, monitor and analyze the right information. The measurement and analysis will be done by various teams depending on the CO structure. But usually program and field teams are involved and often M&E colleagues.
What we look at
As humanitarians we care only about the elements and parts of inflation that are going to affect most either the people that we serve in their daily lives or our ability to serve them.
This means that we will look mostly at the evolution of specific prices such as food prices, rather than at all the different components of inflation. Depending on the specific context, other prices such as fuel prices or the prices of imported goods can also be important to understand who is going to be most impacted in the population.
By tracking the evolution of rent prices, we understand the affordability of housing but also get a good sense more generally of how "late" most contract prices are to adjust to inflation compared to other commodity prices. By estimating this delay, we can anticipate how the impact of inflation on specific groups of population evolves over time and decide when it is time to adjust some programmatic elements accordingly such as the type of assistance or the focus of our targeting.
In theory, we would also want to track wage inflation to understand changes in inequalities and in purchasing power within the population. But wages are generally difficult to observe. Instead, we can monitor expenditures: usually what the most vulnerable groups in the population spend can serve as a good proxy of what they earn.
In contexts of high or rapid inflation, when documenting prices, it's essential to actually record both the price in local currency and its equivalent in a hard currency like USD at that time of measurement. This dual recording makes it easy to track both nominal and real inflation.
Where we get our information
A lot of data about inflation is often readily available. It can come from secondary sources such as national statistics institutions, international financial institutions like the WB or the IMF, as well as in some contexts from NGOs that conduct and coordinate extensive marketplace monitoring such as REACH. These will be one of our primary sources of information.
Whether inflation is high or not, we should anyway be consistently monitoring the price of the (S)MEB in local marketplaces within our areas of operation.
Program teams use this information in their general gap and needs analysis, as well as for specific decisions such as transfer size for cash programming. Yet, even in areas where we don’t use cash and our interventions are sector-specific, monitoring the (S)MEB is recommended as a best practice. It provides insights into recipients' ability to meet their basic needs, which subsequently can influence the efficacy of labeled interventions. In conflict contexts, it also ensures that we can keep using consistent and reliable - if minimal - information about inflation trends in case other sources are for some time not available.
When inflation starts becoming a problem, it is also crucial to start analyzing our (S)MEB data disaggregated, as various commodities and services may experience different inflation rates.
How we use the information
Fundamentally, we will record and plot the prices of the same goods or bunch of goods every month. By simply looking at the graph, we will then be able to consider and compare a few important things, including year-on-year inflation and month-on-month inflation trends, an estimation of the level and the speed of inflation in prices, and the proportion of real inflation and nominal inflation.
For the type of analysis that is relevant to humanitarian programming and operations, we can simply use visual cues to interpret inflation.
Interpreting inflation with visual cues

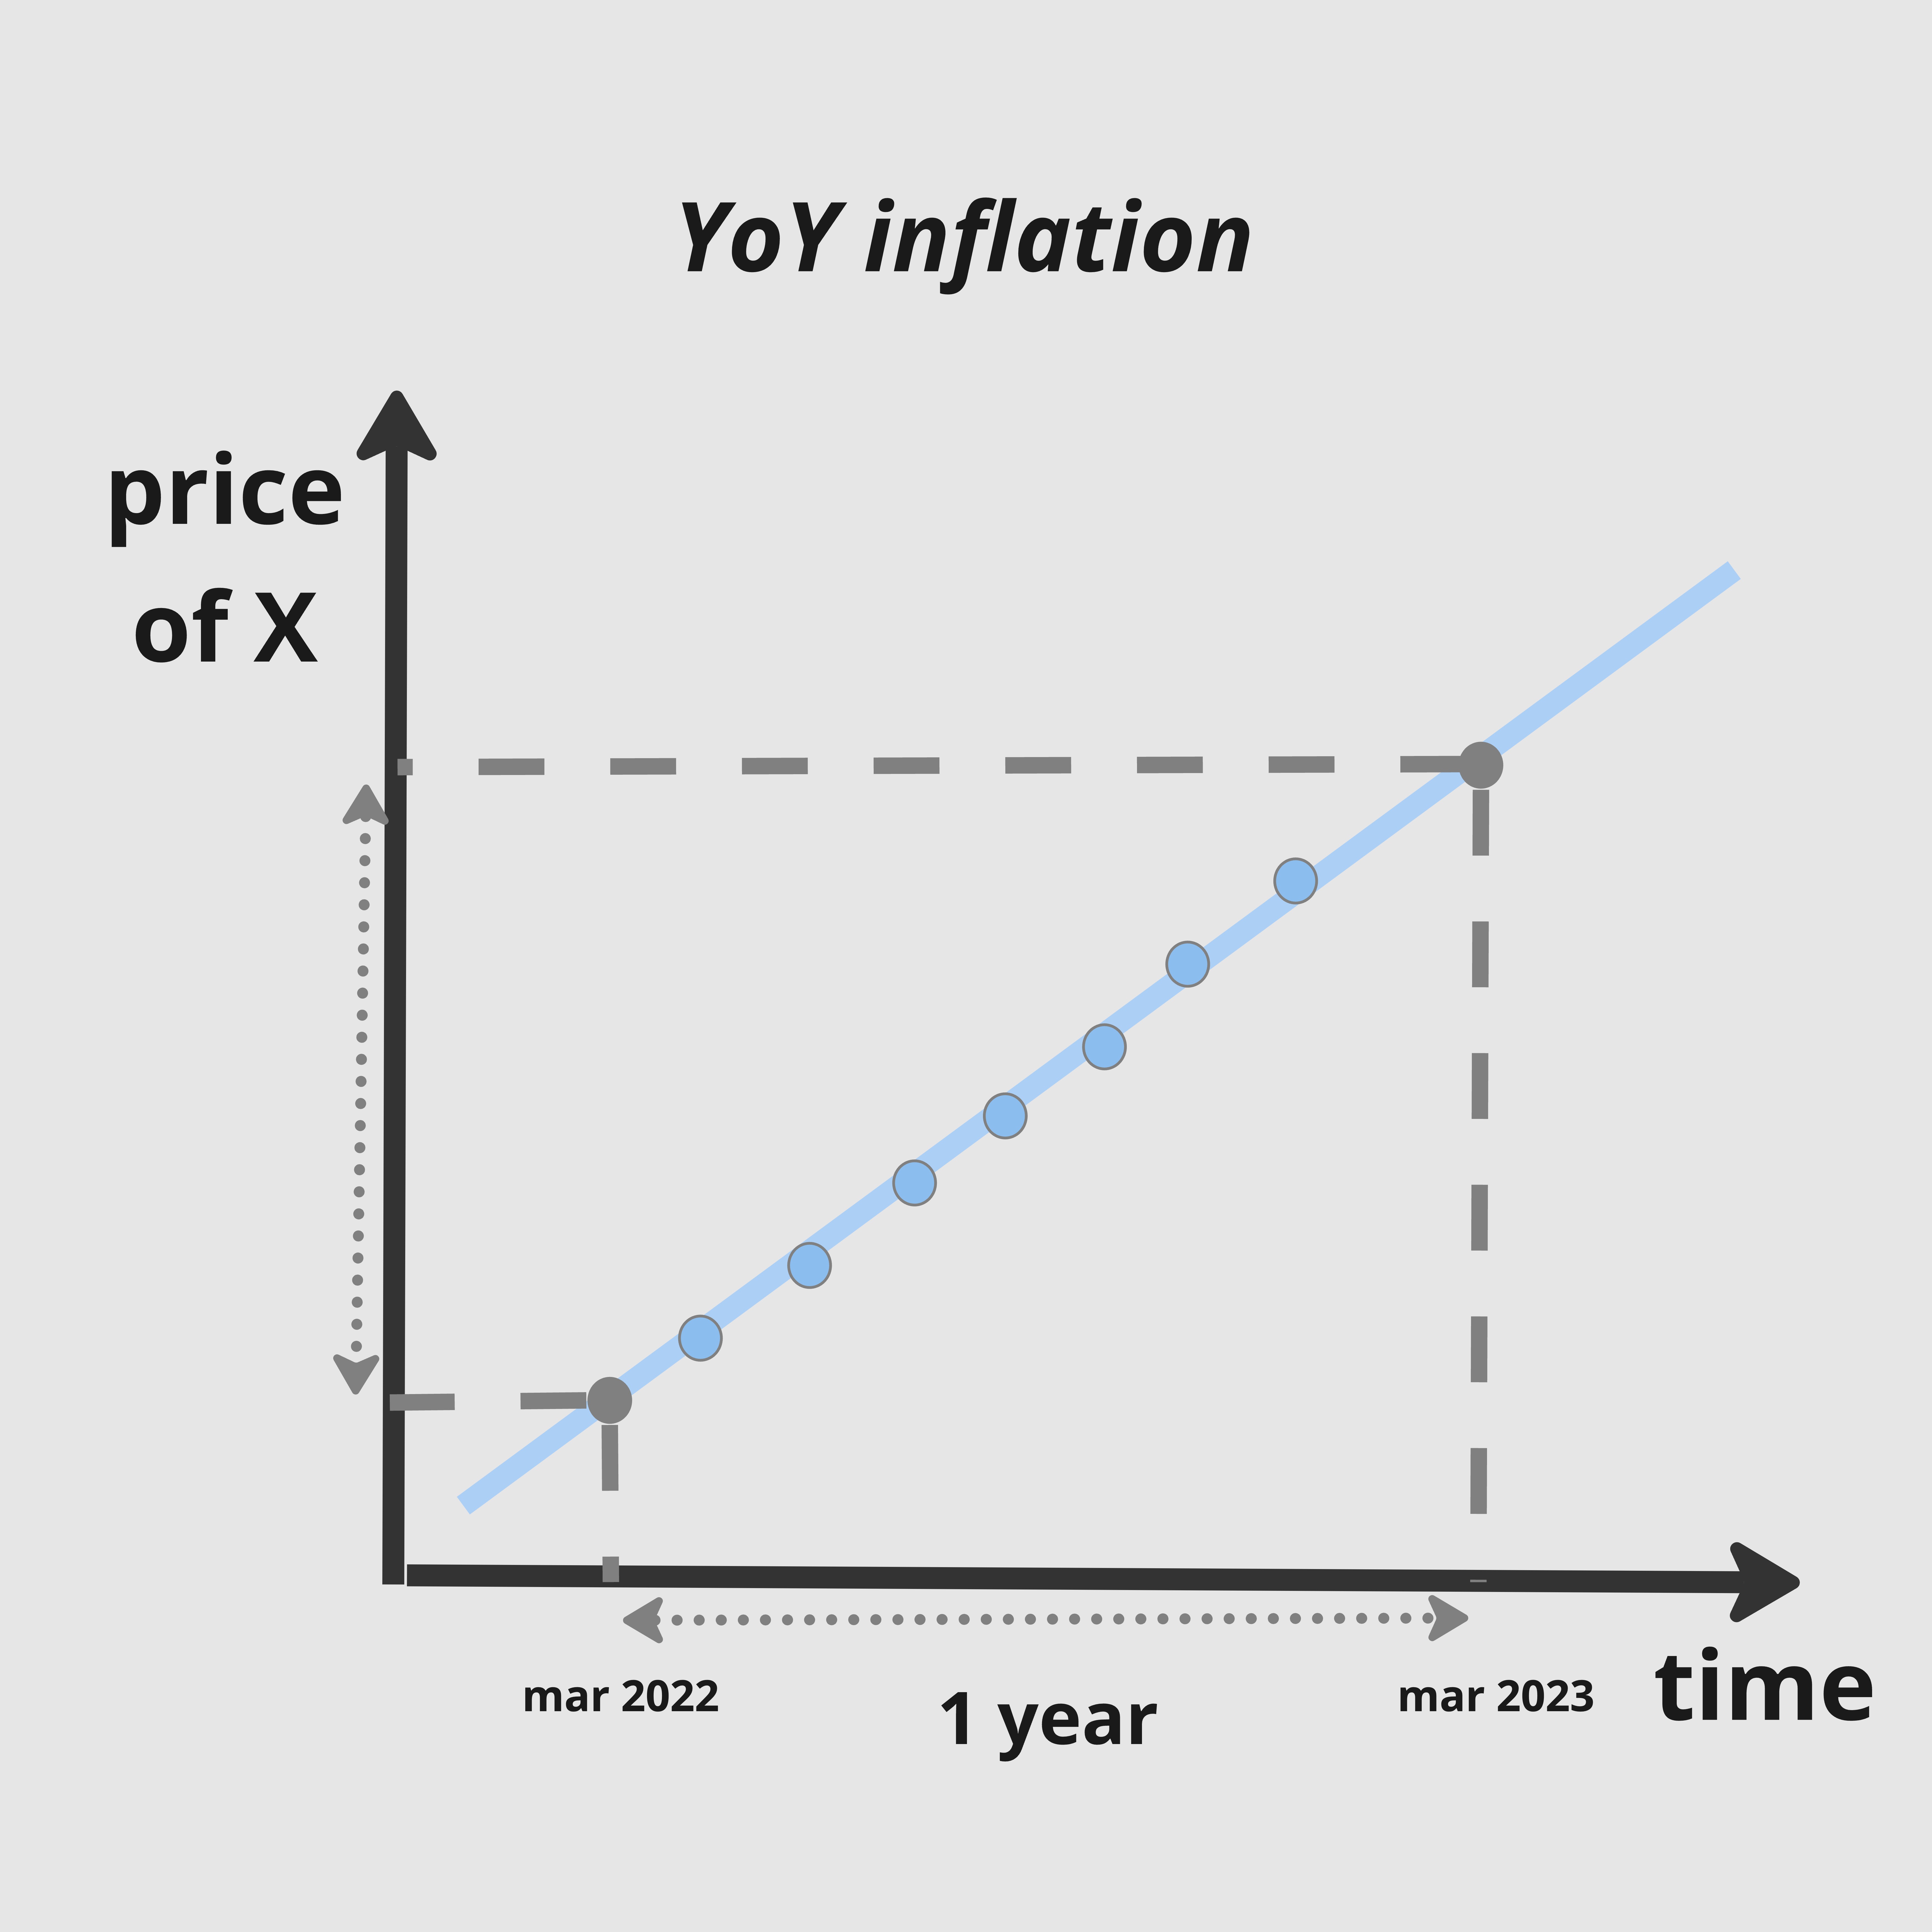
Year-on-Year inflation
This is about how prices change between two dates a year apart.
We 'see' it by plotting the prices of the same goods or bunch of goods every month. The YoY inflation rate is the slope between two points a year apart (e.g. between march 2022 and march 2023 ,etc)

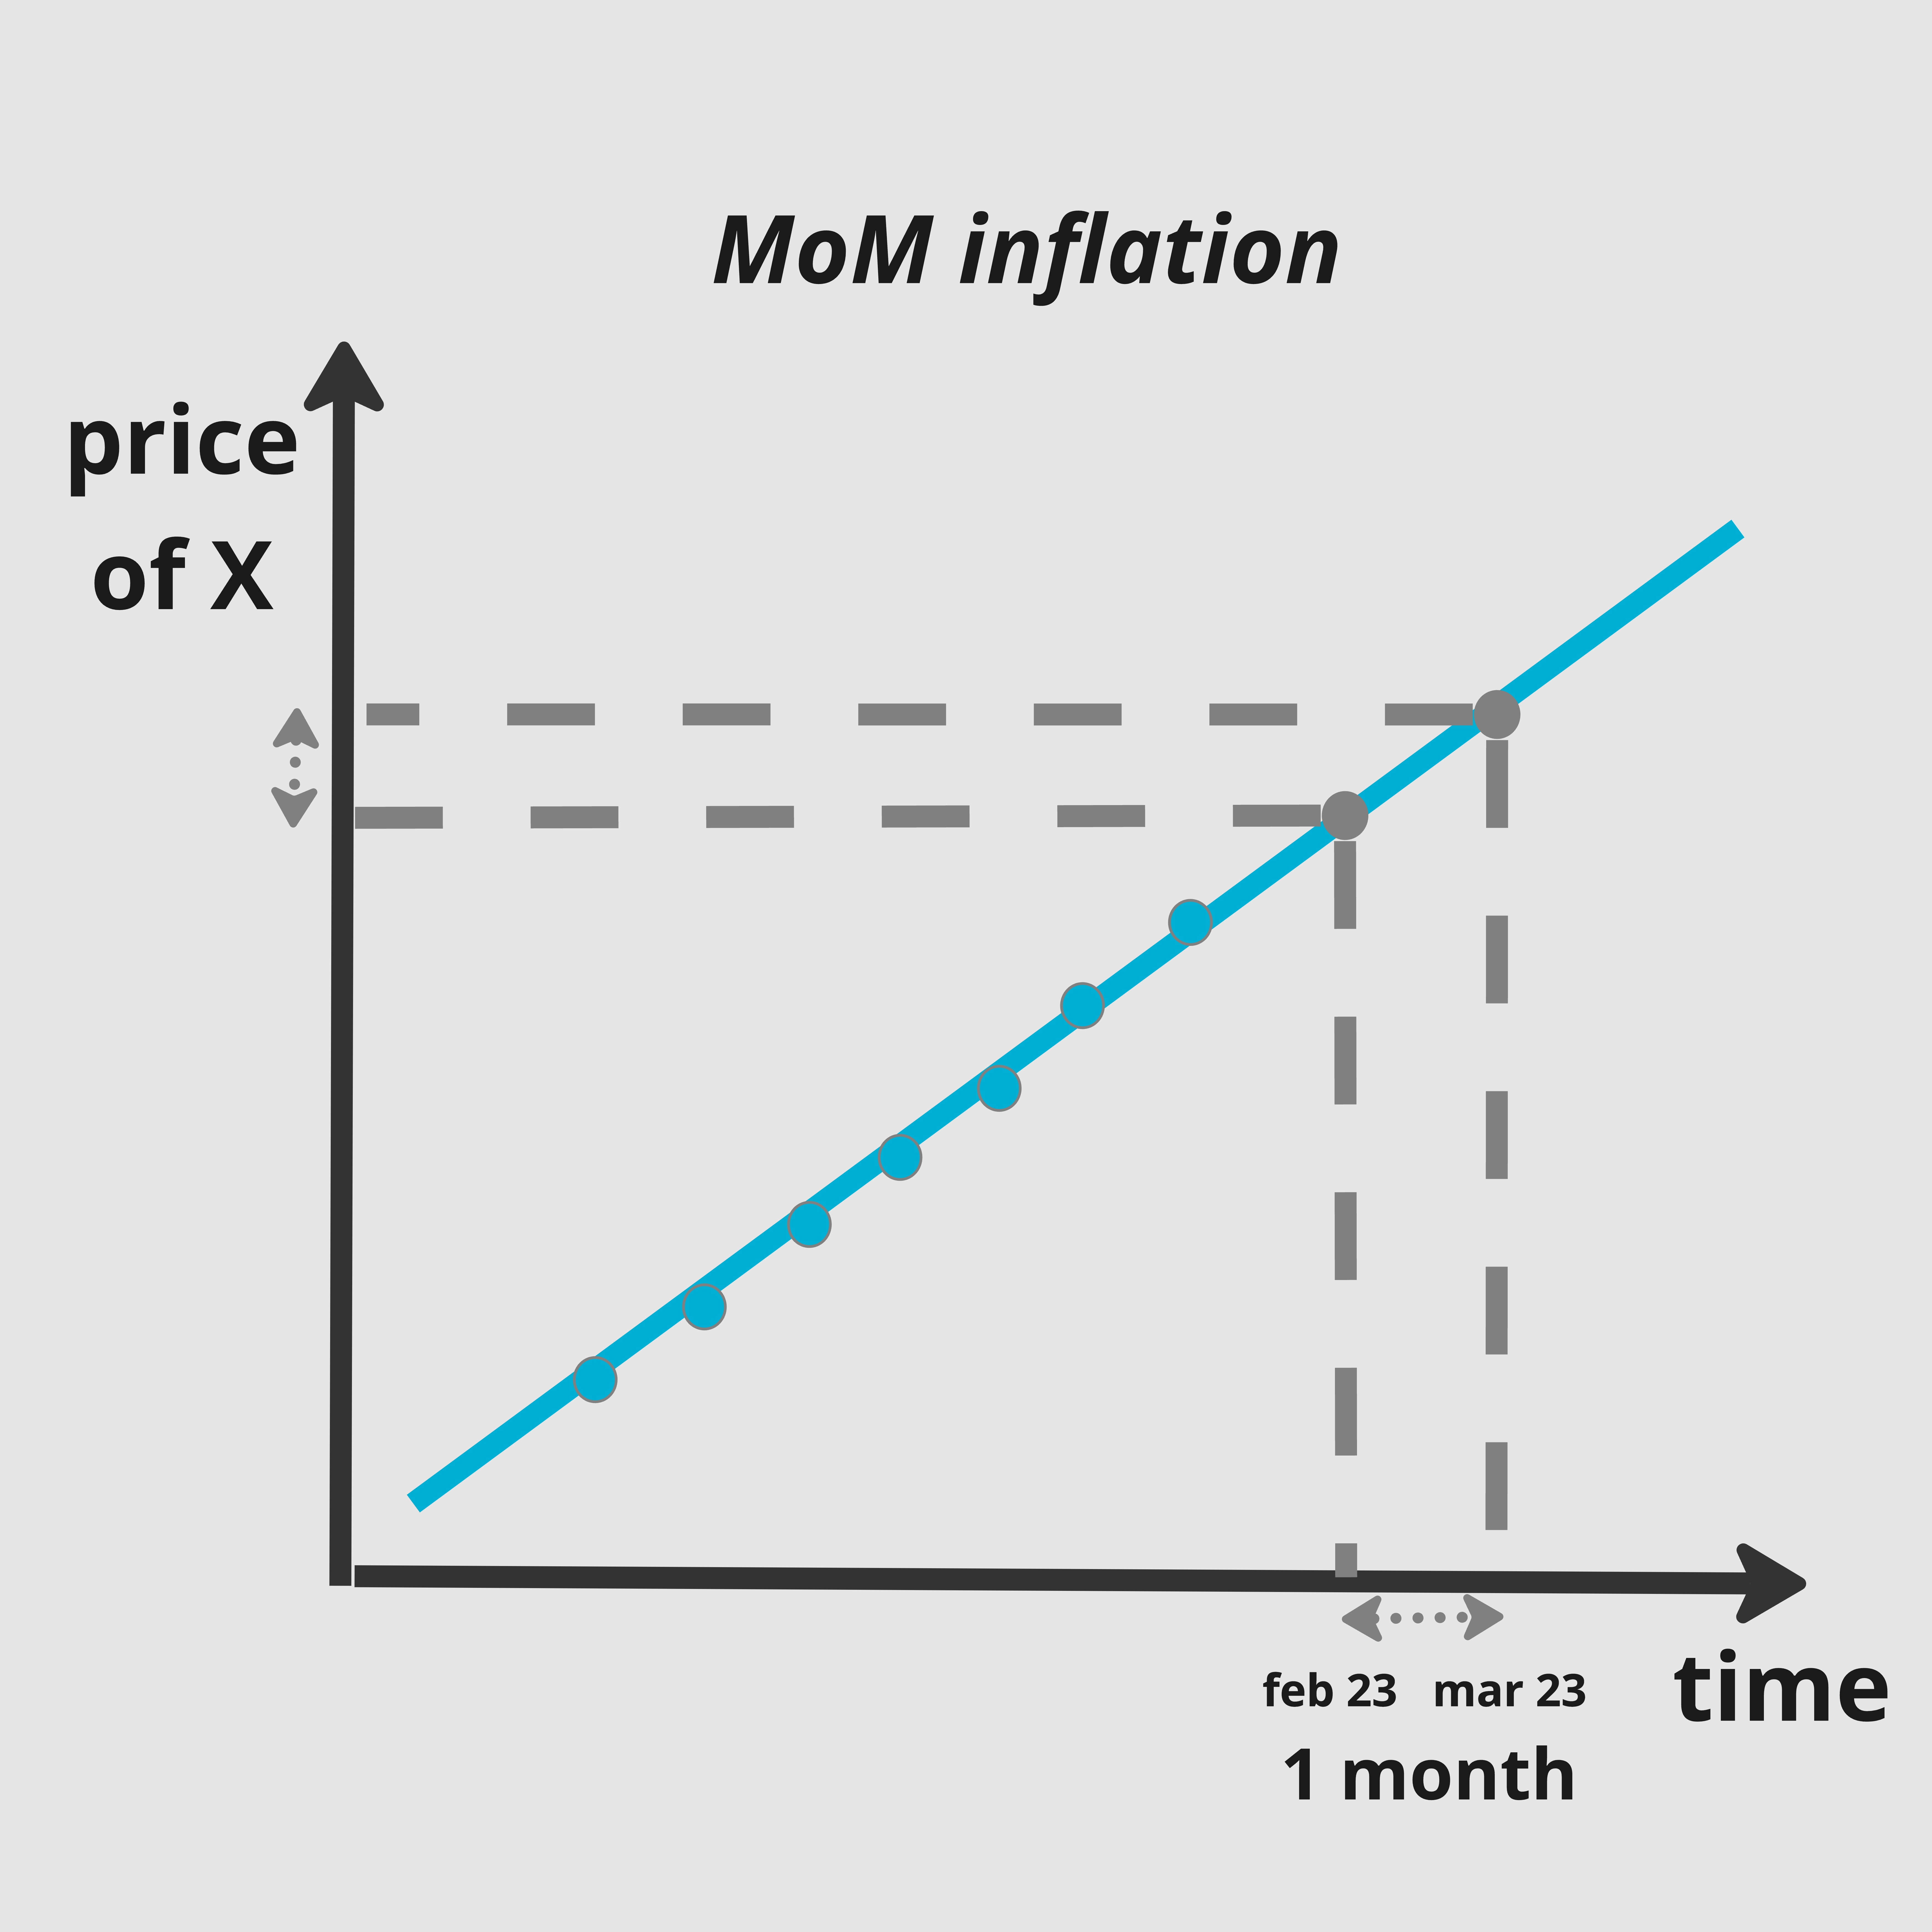
Month-on-Month inflation
This is about how prices change from one month to the next.
On our plot with monthly prices, the MoM inflation rate is the slope between two points a month apart (e.g. between feb 2023 and march 2023)

Levels of inflation
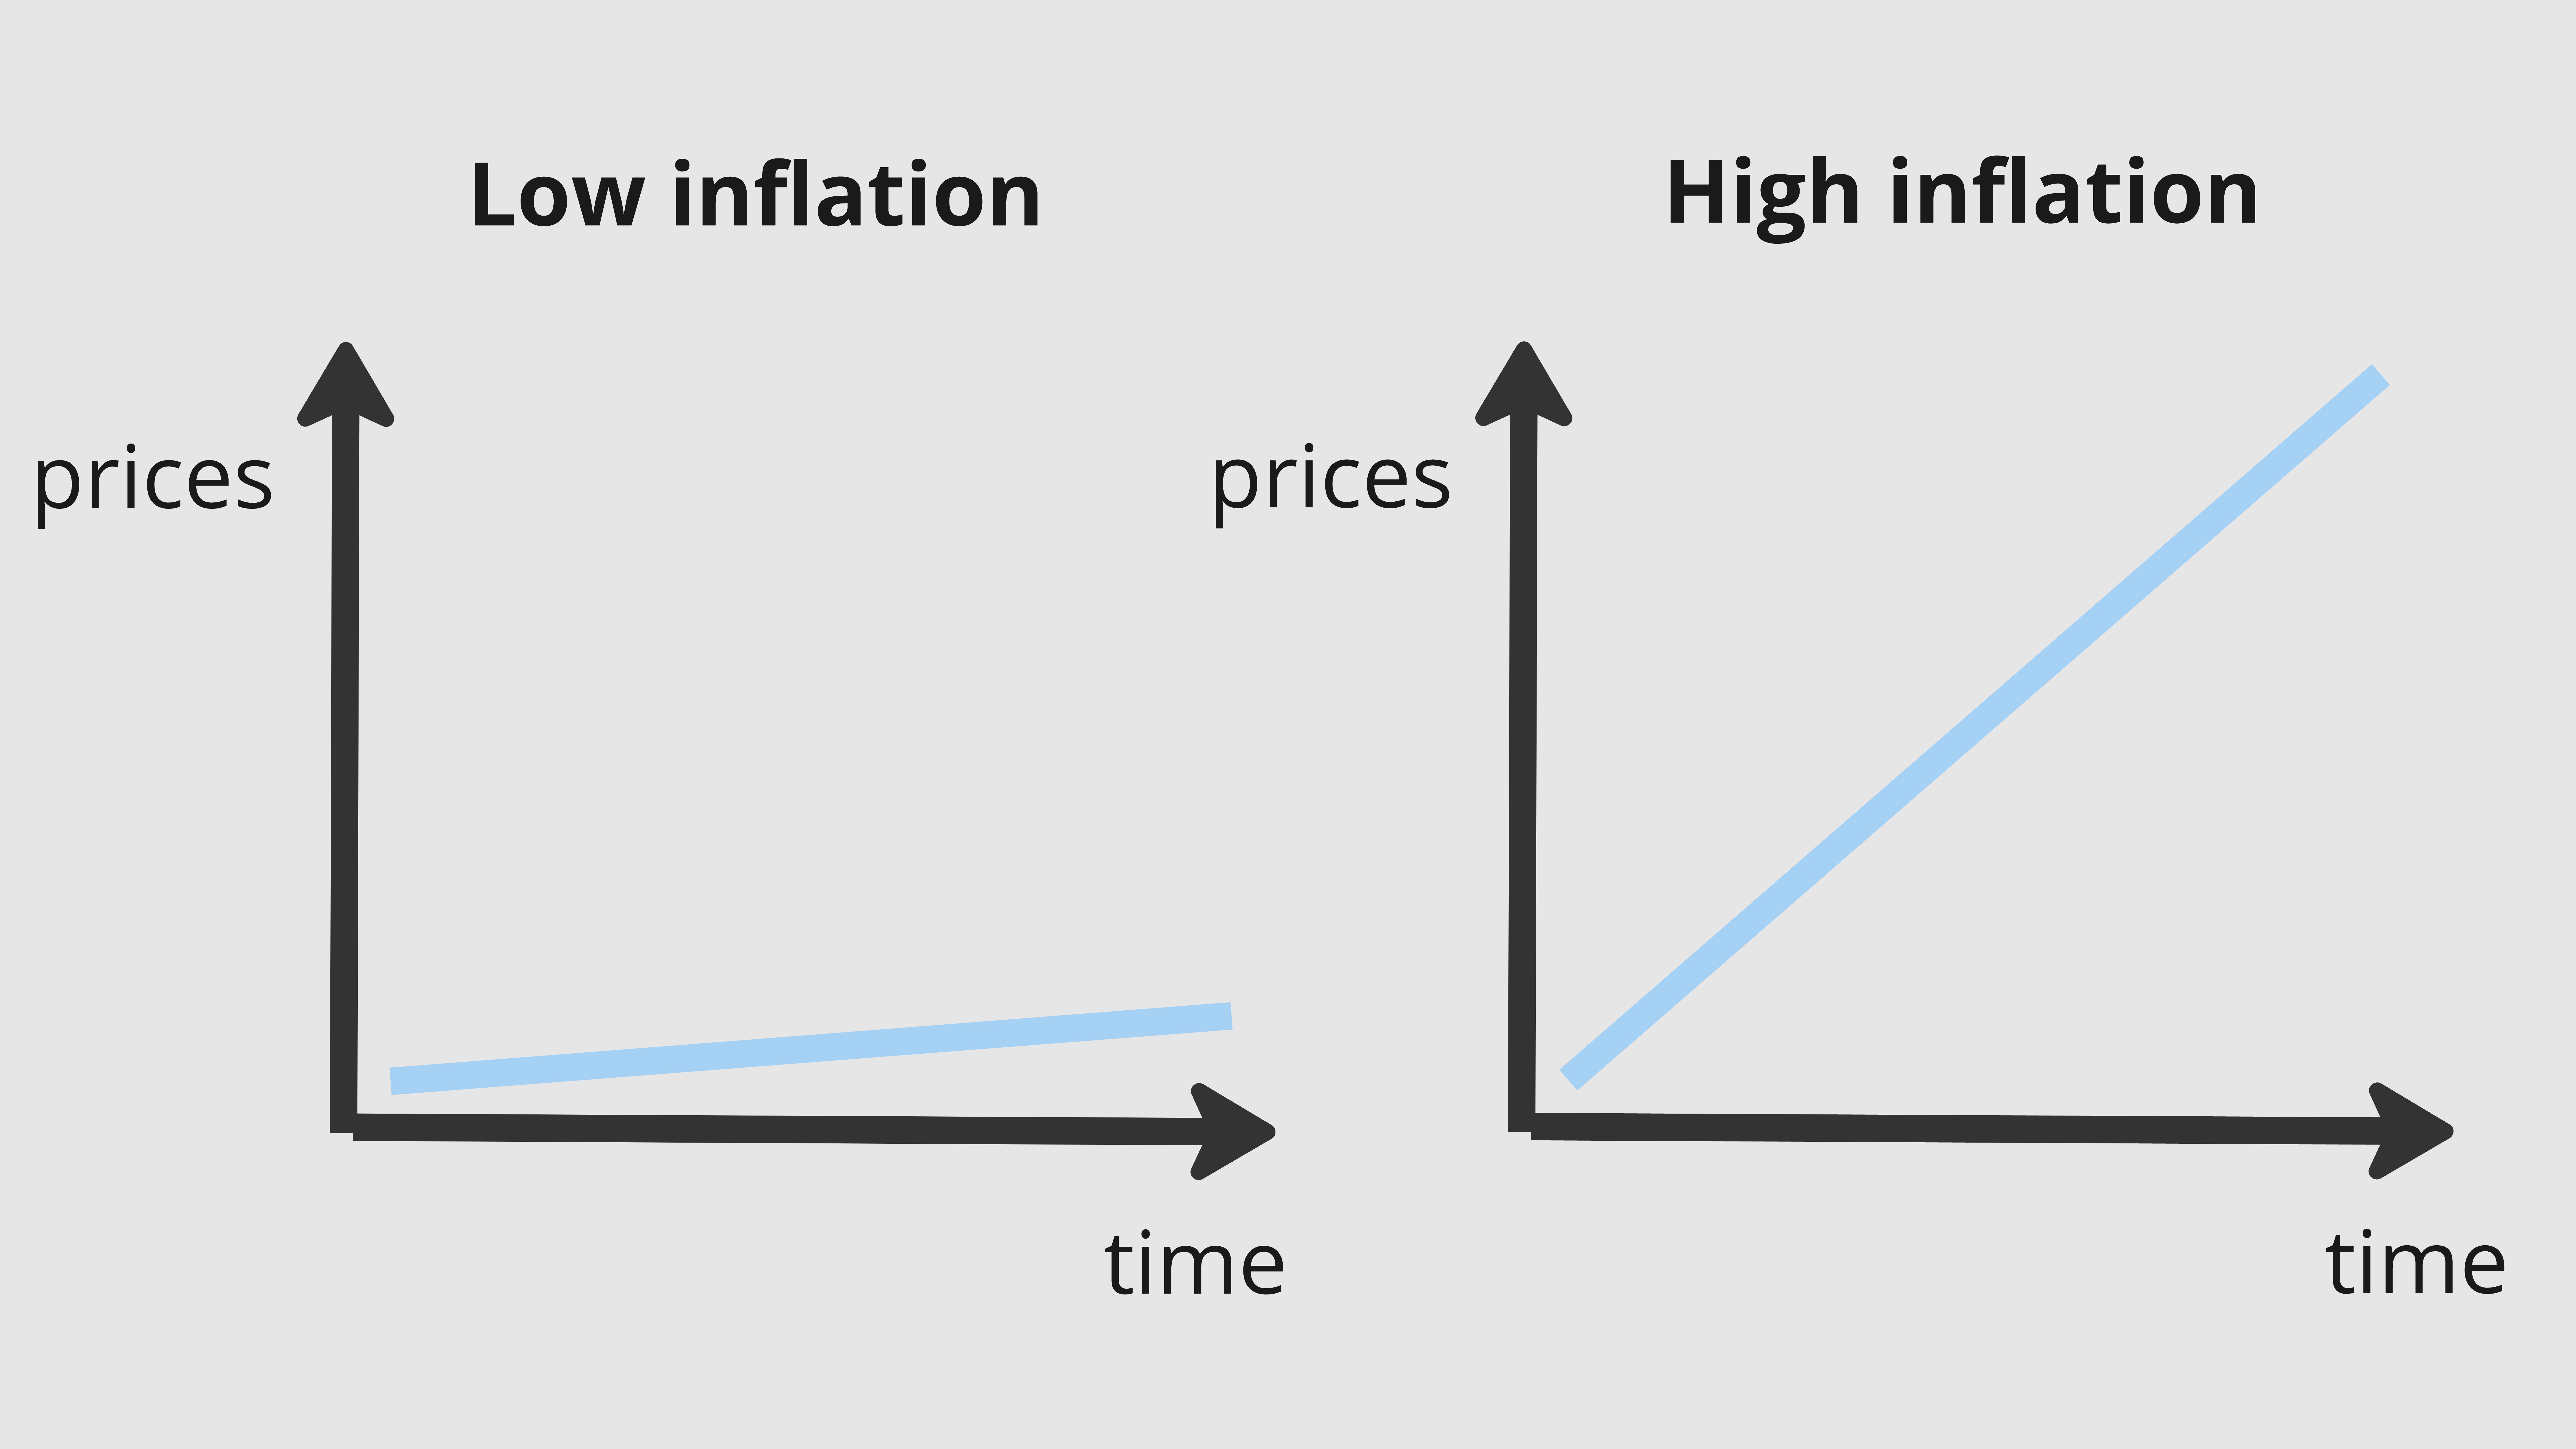
This is about how much prices rise.
We 'see' it in our plot by looking at how vertical the slope of the curve is.

eepSSSpeed of inflation
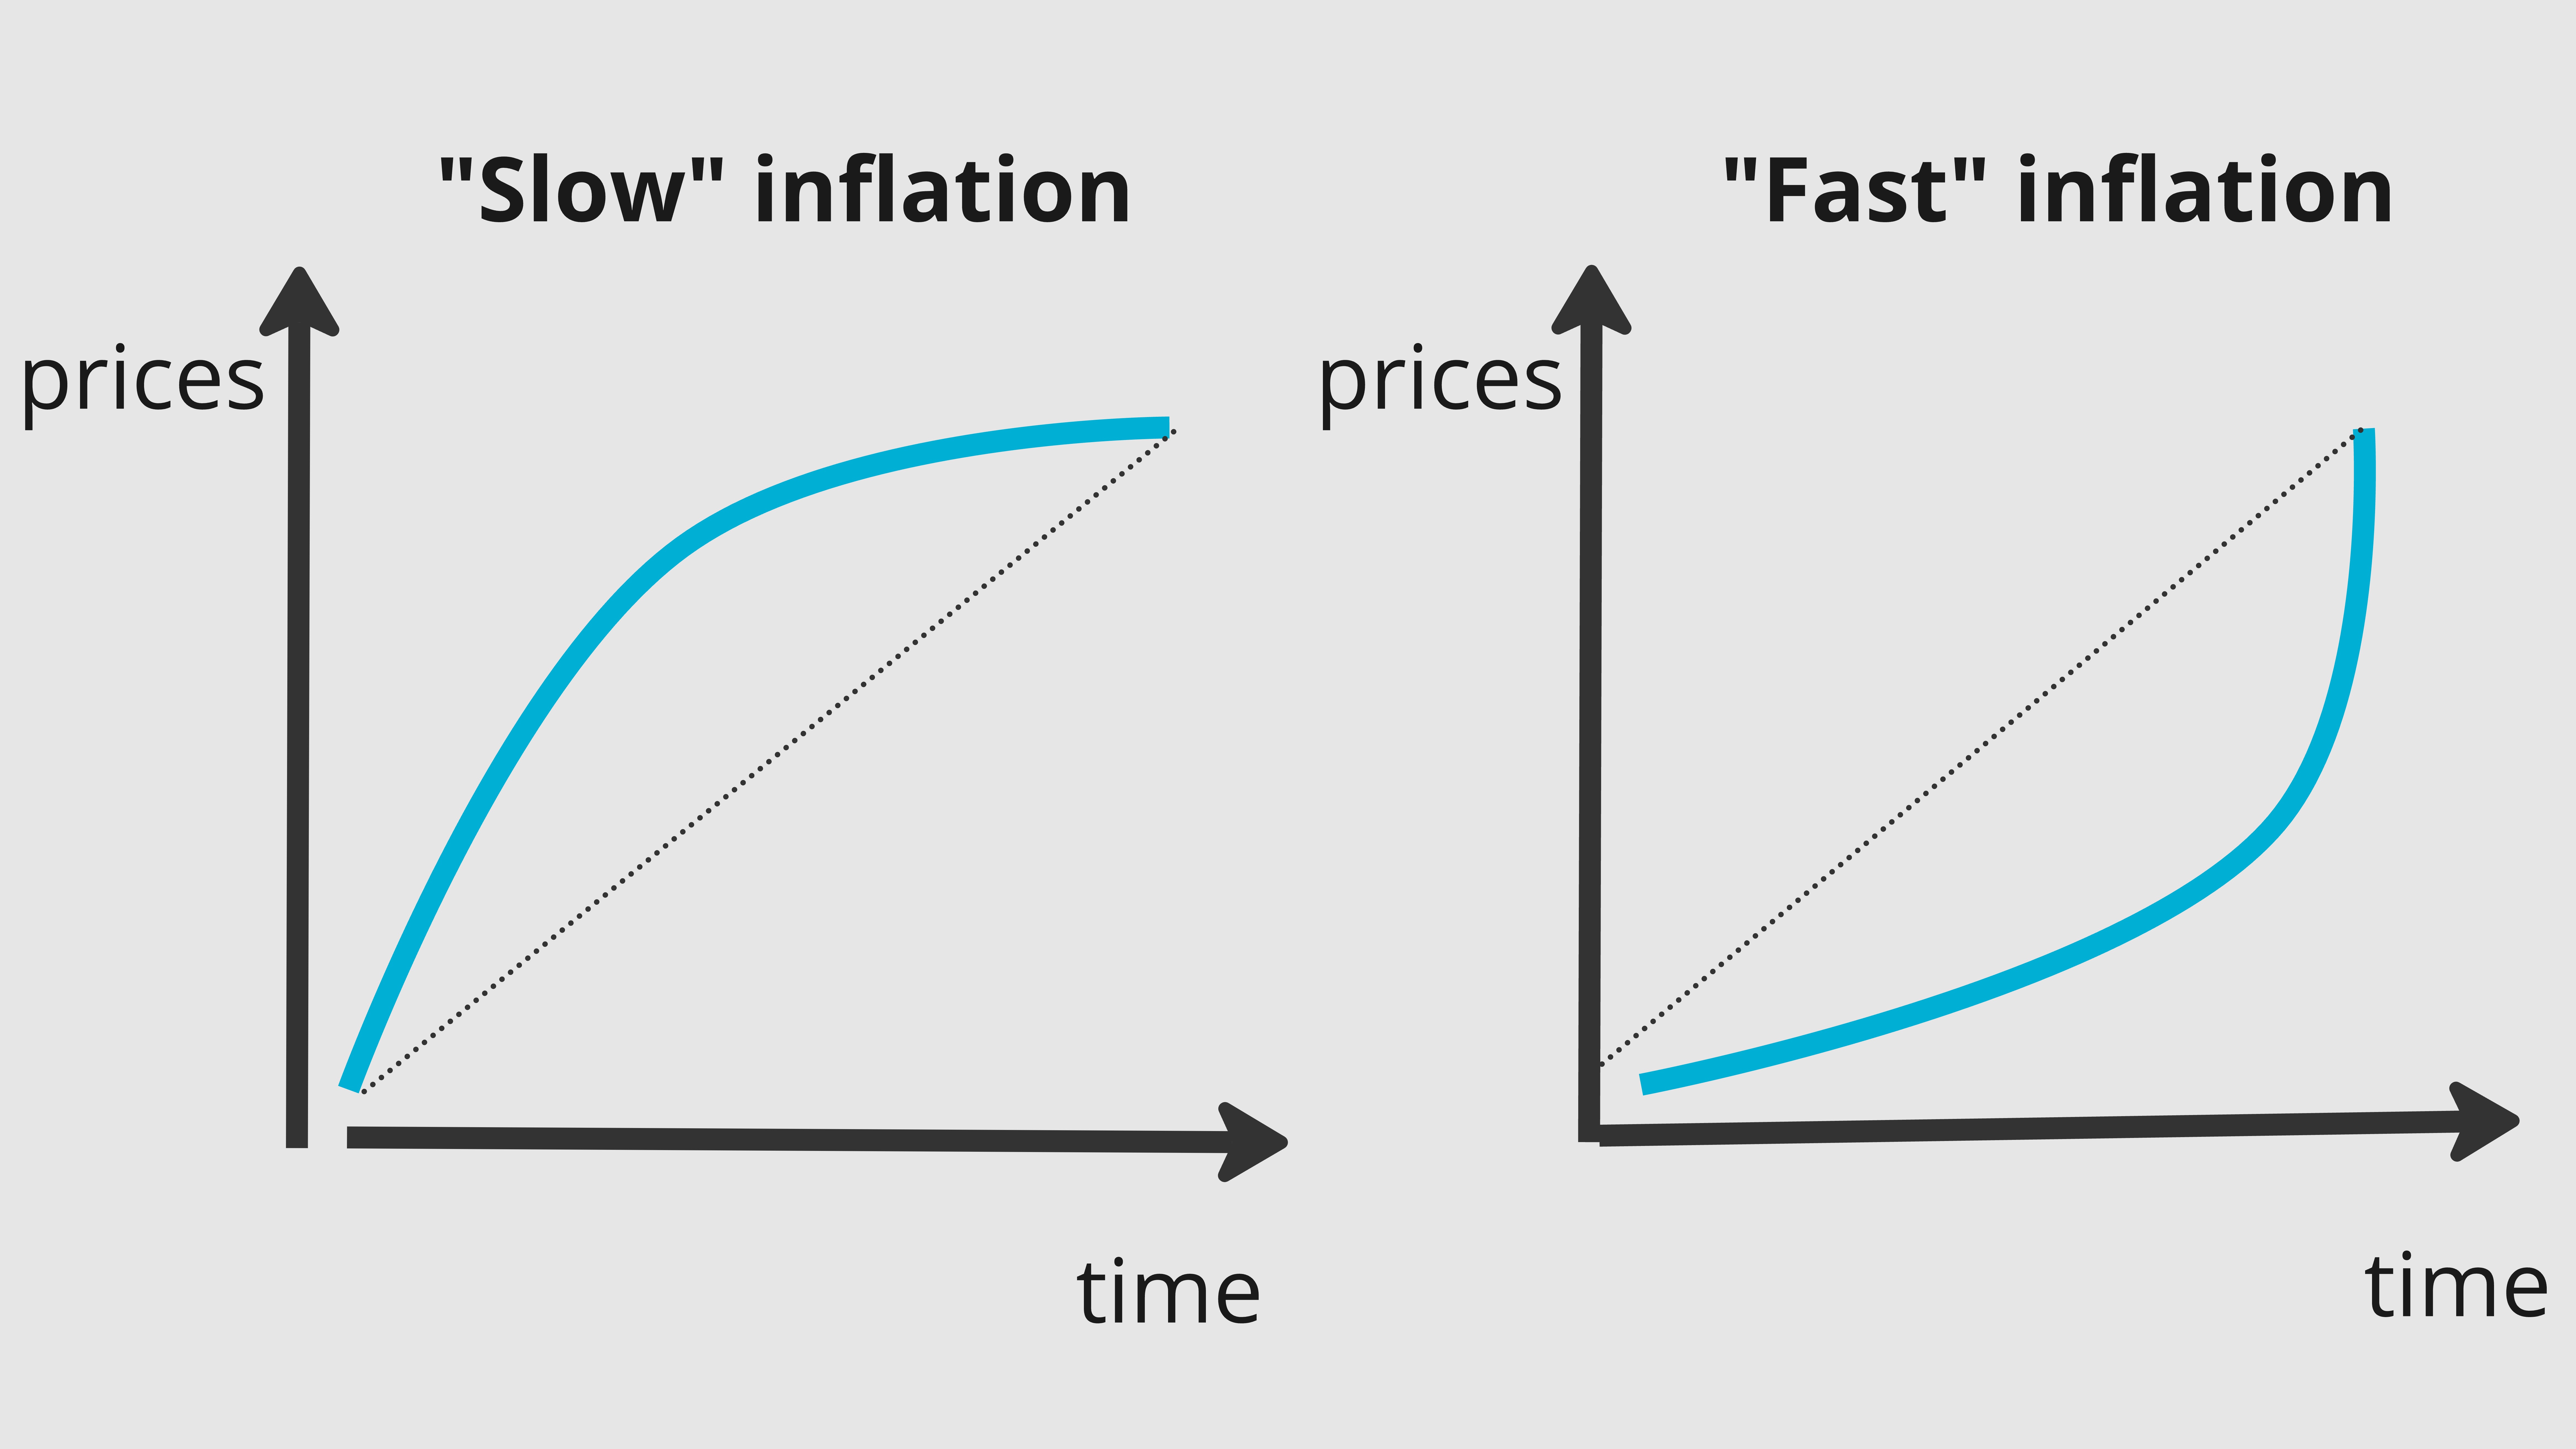
This is about how rapidly prices rise.
We 'see' it in our plot by looking at how convex the shape of the curve is.

Real inflation
This is the part of inflation that comes from having less stuff available for the same amount of money in circulation in the economy.
We 'see' it in our plot by looking at how parallel inflation in local currency and in hard currency are.

Nominal inflation
This is the part of inflation that comes from having more money in circulation in the economy for the same amount of stuff to buy.
We 'see' it in our plot by looking at how divergent inflation in local currency is from inflation in hard currency.
We are not economists, so it is not our job to predict inflation at large. But as any organization that needs to be able to continue to operate in high or fast inflation environments, we need to anticipate inflation appropriately in our cost calculations. So we need to have simple ways to forecast inflation and to use that forecast systematically where needed.
Providing the entire country team with an inflation forecast will often be the responsibility of someone in the support team. More specifically, it often depends on the finance team, since one of the most important use of these forecast will be related to budgets. Whomever ends up being in charge of forecasting inflation, they will typically rely on inflation data collected and provided by other teams (the collation and centralization of inflation data is often done by program or M&E teams, depending on the office setup). The team in charge of making the forecast will also be responsible for regularly checking its validity and adjusting it as needed, as well as reminding other staff to use the forecast appropriately (such as when budgets are drafted, BoQs raised, when contracts are signed, when cash transfers are designed, etc).
All documents that include a price point should also include forecasted inflation over the period for which the document is meant to be valid.
For example, to make a budget we should look at the price of what we need to buy today PLUS the expected inflation over the budget period. Forgetting to forecast inflation does not have much impact on the accuracy of our budgets in times of low or even medium inflation. But it starts being really essential when inflation is high or very high.
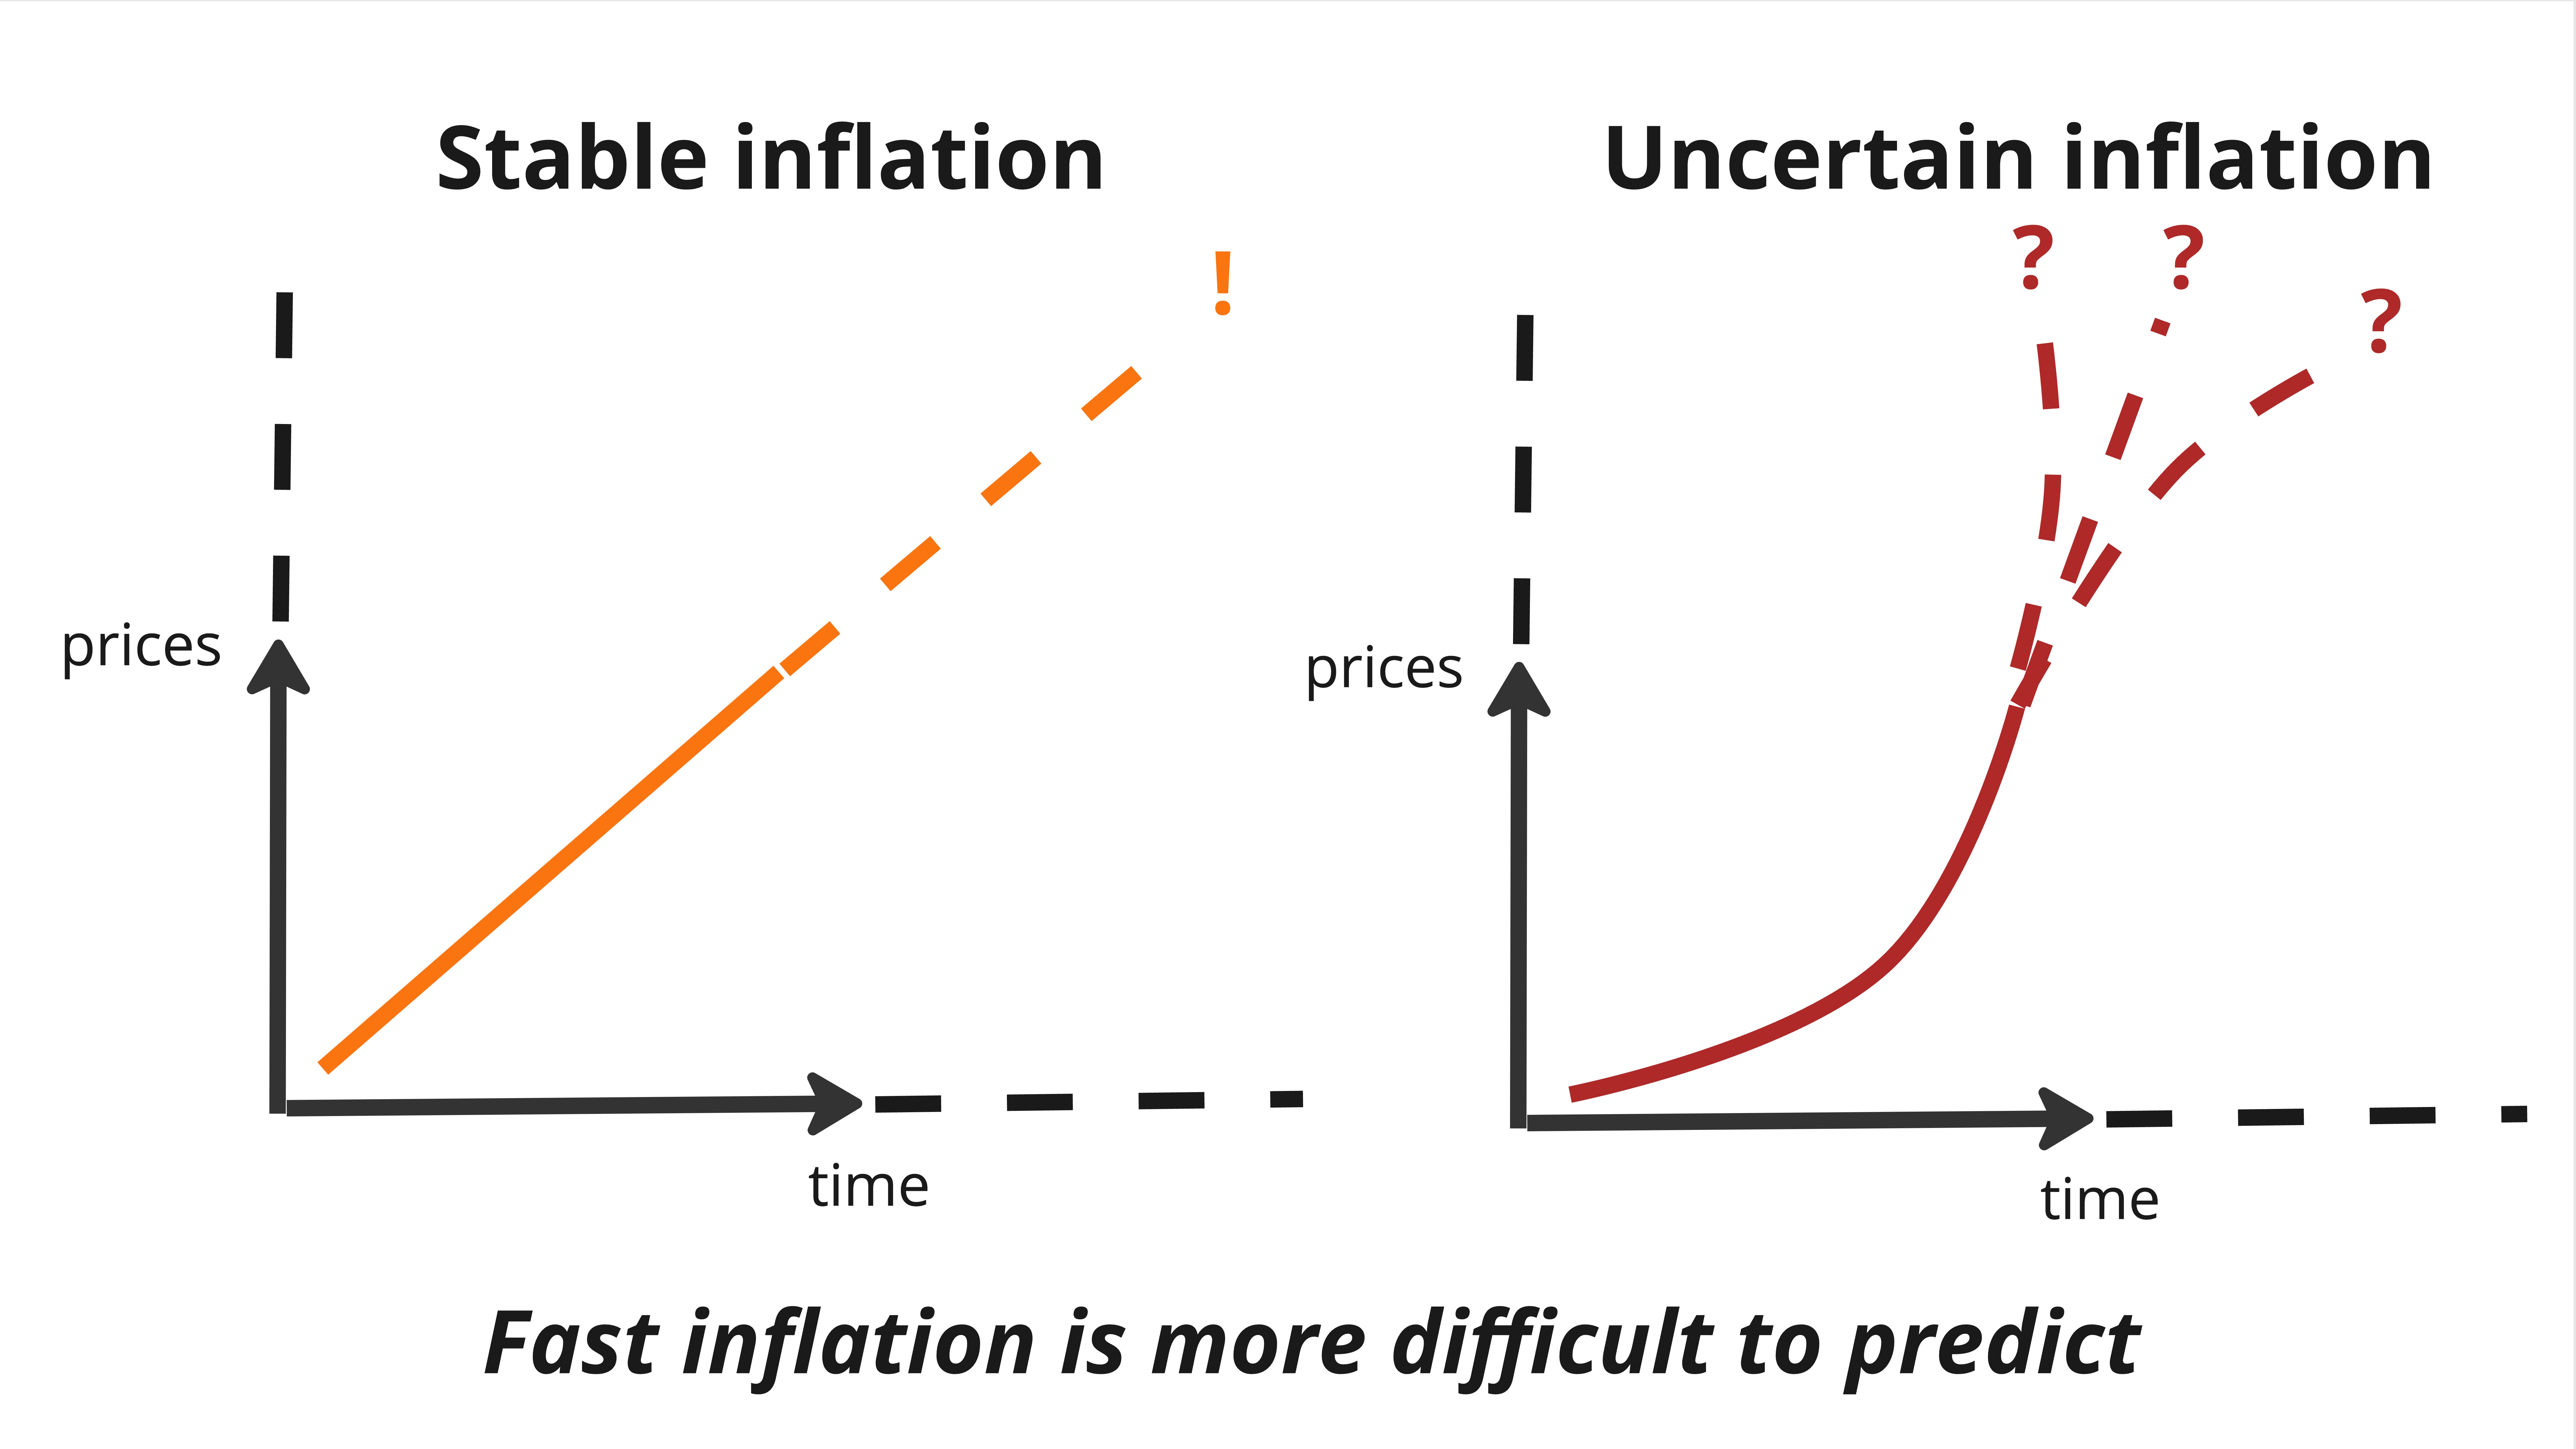
The most simple way to forecast inflation over a given period of time is to use past inflation trends over a similar period of time. For example, if I am trying to predict an inflation rate over the next year, I can basically use the inflation rate observed over the past year. This method is typically reliable in contexts of stable inflation (whether it is low, medium or high), but it tends to fall short when inflation is rapid.
Another approach is to rely on inflation forecast made by secondary sources. Usually, international financial institutions provide regular inflation forecasts by trimesters or by year. This method can be more accurate when inflation is high or very high.
If you expect that whichever extrapolation you can make from past data will be too low (for example because you have reasons to expect a bump in inflation in the future), you can always adjust your forecast accordingly.
What really matters is that you monitor whether the inflation rate you have forecasted and included in your key programmatic and operational documents is actually accurate as time goes by, and that you revise these documents accordingly when needed.
Learn more about


